 PiggyRent
Seattle rent report: October 2026
A 1 bedroom in Seattle lists for a median $2,287 a month, from 3,397 listed apartments in 611 buildings (listings from Aug 16, 2026 to Sep 28, 2026). By neighborhood, the median runs from $3,274 in Denny Triangle to $1,500 in Pinehurst. Here's what Seattle's listings say.
Published · listings from Aug 16, 2026 to Sep 28, 2026 · method · charts and data
What a Seattle apartment lists for.
- Studio
- $1,626 /momedian of 1,501 listings
- 1 bedroom
- $2,287 /momedian of 3,397 listings
- 2 bedrooms
- $3,295 /momedian of 1,355 listings
- 3 bedrooms
- $3,492 /momedian of 228 listings
Medians of the asking rents on 6,582 apartments listed in 1,114 Seattle buildings. Half ask more, half ask less. They are what buildings are asking for a unit today, not what anyone signed.
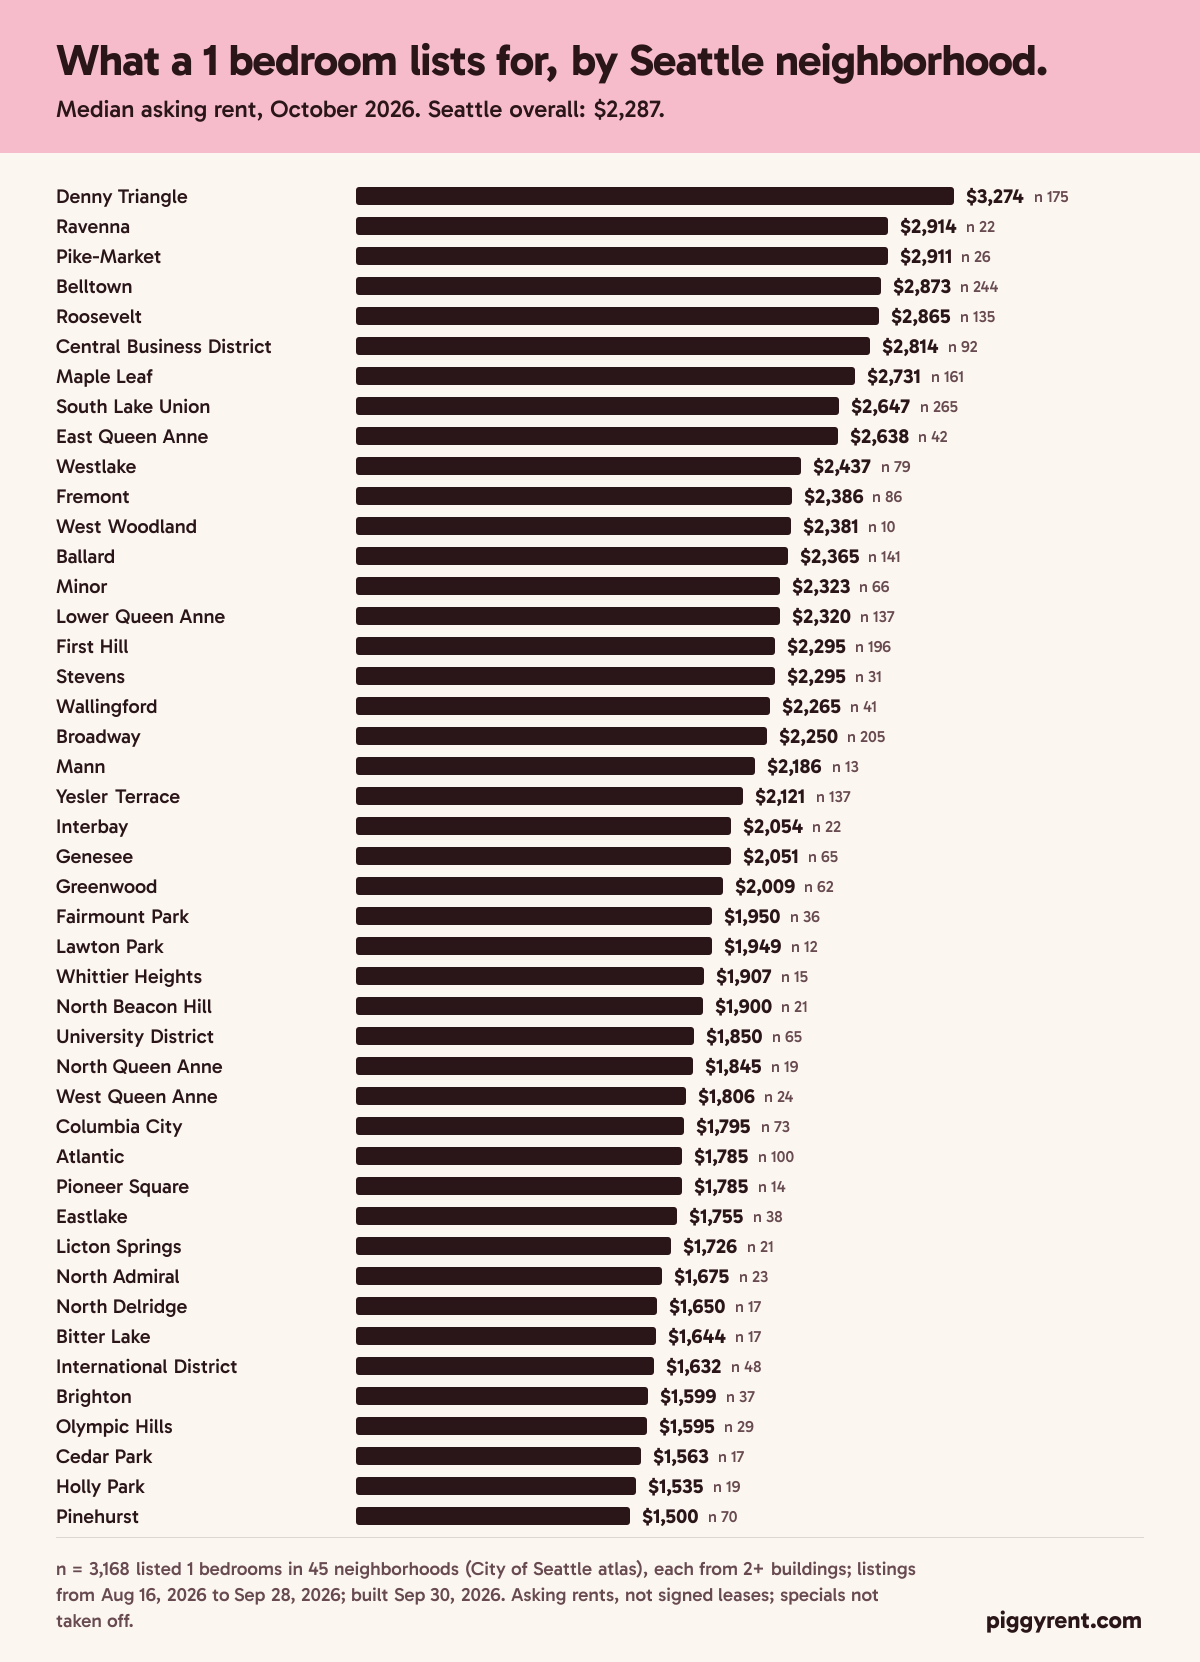
A 1 bedroom lists for $3,274 in Denny Triangle and $1,500 in Pinehurst.
Median 1 bedroom asking rent in each of the 45 Seattle neighborhoods with enough listings, highest first, with the number of listings behind it. Apartment size and age differ from one neighborhood to the next, and a small sample moves more than a large one, so read a neighborhood's figure with its count.
- Denny Triangle$3,274 (175)
- Ravenna$2,914 (22)
- Pike-Market$2,911 (26)
- Belltown$2,873 (244)
- Roosevelt$2,865 (135)
- Central Business District$2,814 (92)
- Maple Leaf$2,731 (161)
- South Lake Union$2,647 (265)
- East Queen Anne$2,638 (42)
- Westlake$2,437 (79)
- Fremont$2,386 (86)
- West Woodland$2,381 (10)
- Ballard$2,365 (141)
- Minor$2,323 (66)
- Lower Queen Anne$2,320 (137)
- First Hill$2,295 (196)
- Stevens$2,295 (31)
- Wallingford$2,265 (41)
- Broadway$2,250 (205)
- Mann$2,186 (13)
- Yesler Terrace$2,121 (137)
- Interbay$2,054 (22)
- Genesee$2,051 (65)
- Greenwood$2,009 (62)
- Fairmount Park$1,950 (36)
- Lawton Park$1,949 (12)
- Whittier Heights$1,907 (15)
- North Beacon Hill$1,900 (21)
- University District$1,850 (65)
- North Queen Anne$1,845 (19)
- West Queen Anne$1,806 (24)
- Columbia City$1,795 (73)
- Atlantic$1,785 (100)
- Pioneer Square$1,785 (14)
- Eastlake$1,755 (38)
- Licton Springs$1,726 (21)
- North Admiral$1,675 (23)
- North Delridge$1,650 (17)
- Bitter Lake$1,644 (17)
- International District$1,632 (48)
- Brighton$1,599 (37)
- Olympic Hills$1,595 (29)
- Cedar Park$1,563 (17)
- Holly Park$1,535 (19)
- Pinehurst$1,500 (70)
22 of these neighborhoods have their own page, linked above. Neighborhoods are the City of Seattle's atlas boundaries: Broadway, for one, is a part of the Capitol Hill district, not all of it.
Every neighborhood, by bedroom count.
Median asking rent, with the number of listings in brackets. A dash means fewer than 10 listings, or listings from one building.
| Neighborhood | Studio | 1 bedroom | 2 bedrooms | 3 bedrooms |
|---|---|---|---|---|
| Denny Triangle Downtown | $2,459 (30) | $3,274 (175) | $4,411 (53) | – |
| Ravenna Northeast | $1,700 (15) | $2,914 (22) | $3,960 (12) | – |
| Pike-Market Downtown | $2,425 (10) | $2,911 (26) | – | – |
| Belltown Downtown | $1,765 (84) | $2,873 (244) | $4,058 (108) | – |
| Roosevelt Northeast | $2,133 (58) | $2,865 (135) | $3,676 (33) | – |
| Central Business District Downtown | $2,288 (20) | $2,814 (92) | $4,507 (38) | – |
| Maple Leaf Northgate | $2,250 (35) | $2,731 (161) | $4,345 (66) | – |
| South Lake Union Cascade | $1,983 (104) | $2,647 (265) | $4,130 (69) | – |
| East Queen Anne Queen Anne | $1,709 (12) | $2,638 (42) | $3,629 (12) | – |
| Westlake Cascade | $1,727 (19) | $2,437 (79) | $3,470 (30) | – |
| Fremont North Central | $1,684 (34) | $2,386 (86) | $4,198 (28) | $4,626 (14) |
| West Woodland Ballard | $1,500 (21) | $2,381 (10) | – | – |
| Ballard | $1,430 (37) | $2,365 (141) | $3,332 (51) | – |
| Minor Central Area | $1,662 (20) | $2,323 (66) | $2,900 (32) | $4,128 (12) |
| Lower Queen Anne Queen Anne | $1,755 (67) | $2,320 (137) | $3,788 (50) | – |
| First Hill Downtown | $1,799 (117) | $2,295 (196) | $3,662 (134) | – |
| Stevens Capitol Hill | $1,400 (12) | $2,295 (31) | – | – |
| Wallingford North Central | $1,553 (31) | $2,265 (41) | $4,192 (18) | – |
| Broadway Capitol Hill | $1,622 (152) | $2,250 (205) | $3,701 (62) | – |
| Mann Central Area | $1,705 (14) | $2,186 (13) | – | – |
| Yesler Terrace Downtown | $2,228 (43) | $2,121 (137) | $3,233 (46) | – |
| Interbay | $1,508 (12) | $2,054 (22) | – | – |
| Genesee West Seattle | $1,698 (16) | $2,051 (65) | – | – |
| Greenwood Northwest | $1,543 (22) | $2,009 (62) | $2,830 (19) | – |
| Fairmount Park West Seattle | $1,650 (16) | $1,950 (36) | – | – |
| Lawton Park Magnolia | – | $1,949 (12) | $2,497 (10) | – |
| Whittier Heights Ballard | – | $1,907 (15) | – | – |
| North Beacon Hill Beacon Hill | $1,548 (12) | $1,900 (21) | $2,575 (10) | – |
| University District | $1,175 (152) | $1,850 (65) | $2,095 (101) | $2,000 (23) |
| North Queen Anne Queen Anne | $1,602 (18) | $1,845 (19) | – | – |
| West Queen Anne Queen Anne | – | $1,806 (24) | $2,915 (18) | – |
| Columbia City Rainier Valley | $1,196 (39) | $1,795 (73) | $2,998 (21) | – |
| Atlantic Central Area | $1,499 (54) | $1,785 (100) | $2,814 (42) | – |
| Pioneer Square Downtown | – | $1,785 (14) | – | – |
| Eastlake Cascade | $1,571 (21) | $1,755 (38) | – | – |
| Licton Springs Northgate | – | $1,726 (21) | $2,462 (20) | – |
| North Admiral West Seattle | – | $1,675 (23) | – | – |
| North Delridge Delridge | $1,845 (10) | $1,650 (17) | – | – |
| Bitter Lake Northwest | – | $1,644 (17) | $1,925 (13) | – |
| International District Downtown | $1,150 (27) | $1,632 (48) | $1,600 (13) | – |
| Brighton Rainier Valley | $1,285 (10) | $1,599 (37) | – | – |
| Olympic Hills Lake City | – | $1,595 (29) | – | – |
| Cedar Park Lake City | – | $1,563 (17) | $2,215 (17) | – |
| Holly Park Beacon Hill | – | $1,535 (19) | – | – |
| Pinehurst Northgate | – | $1,500 (70) | $2,275 (14) | $1,999 (28) |
| Mount Baker Rainier Valley | $1,100 (15) | – | – | – |
| University Heights University District | $1,099 (19) | – | – | – |
Same building, same floor plan, different asking rent.
When a Seattle building lists two or more units of the identical floor plan (same plan name, bedrooms, bathrooms and square feet), the units are often not listed at one price. 451 of 994 Seattle floor-plan groups span at least $100 (45%), across 365 buildings. 218 span $200 or more, and the median spread is $78.
Floor, view, finishes and move-in date explain some of it: a higher floor usually asks more. What it shows is that a building's first price for a layout is not its only price, and $100 a month is $1,200 a year for the same layout. It does not measure what anyone saved or paid.
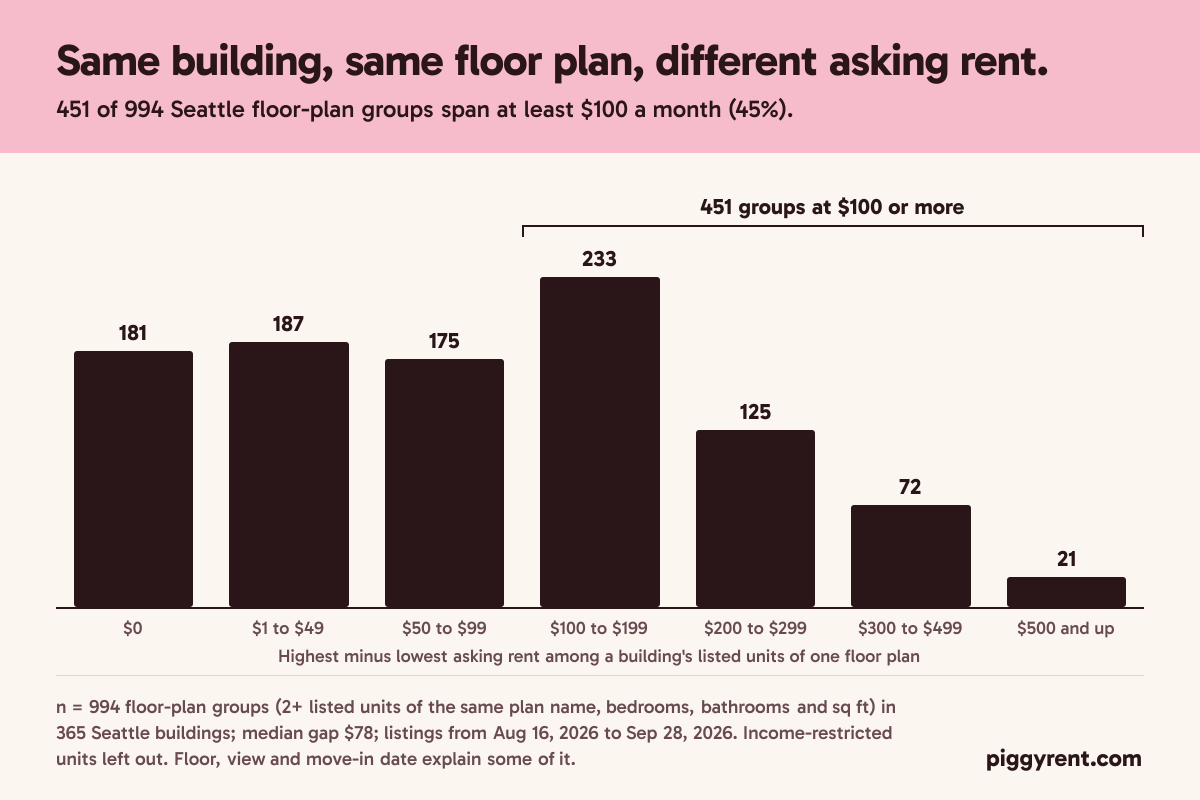
In Broadway, 20 of 57 groups span at least $100 (median $60). In the Capitol Hill district, 24 of 64 groups span at least $100 (median $61).
The typical big Seattle building listed 1 in 17 of its apartments.
Of 394 Seattle buildings with 50 or more apartments built by 2024, the median had 6.0% of its units listed in the window, and 57 had 1 in 10 or more. Listed is not vacant: a listing can be a unit coming free in a few weeks.
Beyond Seattle: the Eastside and the South Sound.
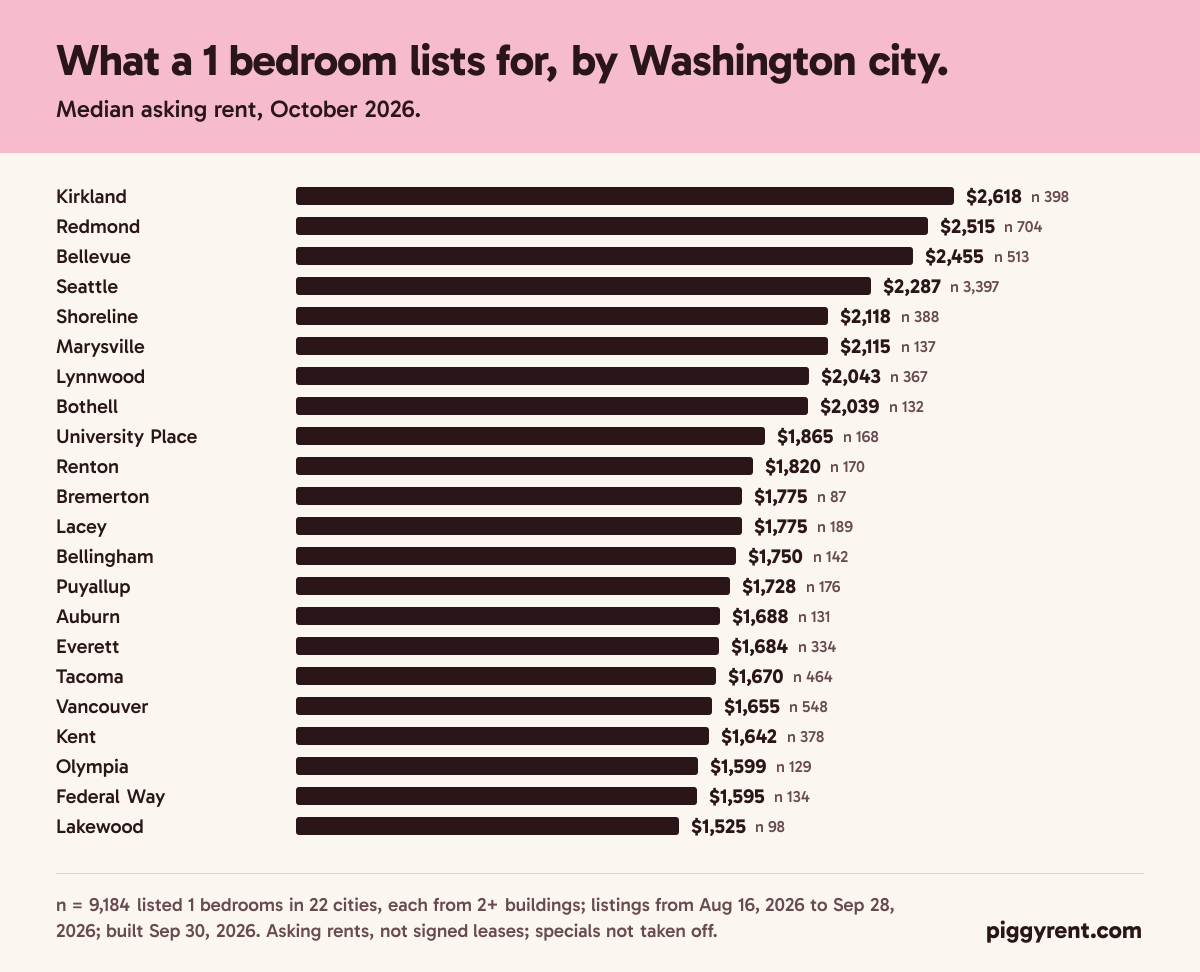
On the Eastside, a 1 bedroom lists for a median $2,455 in Bellevue, $2,515 in Redmond, $2,618 in Kirkland, $2,039 in Bothell, $1,820 in Renton. In the South Sound, $1,670 in Tacoma, $1,525 in Lakewood, $1,728 in Puyallup, $1,865 in University Place, $1,595 in Federal Way, $1,642 in Kent, $1,688 in Auburn.
| City | Studio | 1 bedroom | 2 bedrooms | 3 bedrooms |
|---|---|---|---|---|
| Kirkland | $2,022 (68) | $2,618 (398) | $3,157 (220) | $4,289 (30) |
| Redmond | $2,023 (116) | $2,515 (704) | $3,264 (375) | $4,122 (87) |
| Bellevue | $1,662 (270) | $2,455 (513) | $3,216 (336) | $2,464 (72) |
| Seattle | $1,626 (1501) | $2,287 (3397) | $3,295 (1355) | $3,492 (228) |
| Shoreline | $1,740 (137) | $2,118 (388) | $2,910 (111) | $2,487 (20) |
| Marysville | – | $2,115 (137) | $2,500 (143) | $2,858 (80) |
| Lynnwood | $1,730 (95) | $2,043 (367) | $2,298 (339) | $2,745 (50) |
| Bothell | $1,295 (55) | $2,039 (132) | $2,450 (169) | $3,129 (59) |
| University Place | – | $1,865 (168) | $2,490 (113) | $3,072 (14) |
| Renton | $1,606 (47) | $1,820 (170) | $2,199 (243) | $2,750 (60) |
| Bremerton | – | $1,775 (87) | $2,170 (117) | $2,393 (26) |
| Lacey | $1,597 (19) | $1,775 (189) | $2,168 (166) | $2,650 (21) |
| Bellingham | $1,539 (63) | $1,750 (142) | $2,005 (165) | $2,400 (56) |
| Puyallup | – | $1,728 (176) | $1,999 (238) | $2,585 (80) |
| Auburn | – | $1,688 (131) | $2,032 (107) | $2,335 (32) |
| Everett | $1,523 (27) | $1,684 (334) | $1,953 (390) | $2,421 (101) |
| Tacoma | $1,408 (186) | $1,670 (464) | $1,855 (441) | $2,424 (114) |
| Vancouver | $1,530 (77) | $1,655 (548) | $1,823 (846) | $2,320 (198) |
| Kent | $1,444 (28) | $1,642 (378) | $1,935 (347) | $2,600 (69) |
| Olympia | $1,345 (85) | $1,599 (129) | $1,949 (157) | $2,295 (27) |
| Federal Way | $1,632 (14) | $1,595 (134) | $1,900 (169) | $2,311 (54) |
| Lakewood | – | $1,525 (98) | $1,857 (169) | $2,447 (46) |
Since the last report.
This is the first report, so there is nothing to compare it with yet. The rent data is updated every two weeks and each report is a snapshot of one refresh, so a comparison starts with the report built from the next one.
How we got these numbers, and their limits.
- Asking rents, not signed leases. Apartments listed on Apartments.com and Zillow, listings from Aug 16, 2026 to Sep 28, 2026. Move-in specials aren't taken off.
- Each apartment counts once, even when both sites list it or it was seen in several weeks.
- Market-rate apartments only. Whole houses, furnished units and income-restricted units whose listing says so (MFTE and other affordable-housing programs, 357 Seattle listings this month) are left out.
- Every figure comes from two or more buildings and ten or more listings, and no building is named.
- “Seattle” overall is every listing with a Seattle address, which takes in a few just outside the city limits. Neighborhoods and districts are the City of Seattle's Neighborhood Map Atlas.
- The same-plan spread is the highest asking rent minus the lowest among a building's listed units of one floor plan. 991 of the 994 groups were all seen on the same day, so it is not a price change over time.
- Listings lean toward large, professionally managed buildings, which list many units at once. Small landlords are under-represented.
- The full method, and how our Seattle figure compares with Apartment List and Zillow.
Charts and data for this report.
Free to publish with a credit to PiggyRent (piggyrent.com). Every chart carries its own sample size and dates. Questions, or a cut of the data we haven't published: hello@piggyrent.com.
- seattle-1br-ladder.png Chart: 1 bedroom median asking rent by Seattle neighborhood
- seattle-same-plan-spread.png Chart: how far apart identical floor plans are listed
- wa-cities-1br.png Chart: 1 bedroom median asking rent by Washington city
- seattle-neighborhoods.csv Data: every Seattle neighborhood by bedroom count, with listing counts
- wa-cities.csv Data: Washington cities by bedroom count, with listing counts
- same-plan-spread.csv Data: the same-plan spread in dollar bands
- method.txt The method and its limits, as plain text
Embed the neighborhood chart.
A static image and a credit line: no script, no iframe, nothing that tracks your readers.
<figure>
  <img src="https://piggyrent.com/press/seattle-2026-10/seattle-1br-ladder.png" width="1200" alt="Median asking rent for a 1 bedroom by Seattle neighborhood, October 2026, from PiggyRent" style="max-width:100%;height:auto">
  <figcaption>Median asking rent, listings from Aug 16, 2026 to Sep 28, 2026. Asking rents, not signed leases. Source: <a href="https://piggyrent.com/rent/reports/seattle-2026-10">PiggyRent</a>.</figcaption>
</figure>
From November, a new report comes out the first Wednesday of each month. All reports.
Other metros.
- Atlanta rent report: October 2026
- Boston rent report: October 2026
- Chicago rent report: October 2026
- Dallas-Fort Worth rent report: October 2026
- Houston rent report: October 2026
- Los Angeles rent report: October 2026
- Miami rent report: October 2026
- New York rent report: October 2026
- Philadelphia rent report: October 2026
- San Francisco Bay rent report: October 2026
Is your rent a good deal?
Check your own rent against these listings. It takes about a minute, and it's free for renters.
Check my rent